

280 players dressed and played for an NLL team in the 2018-19 season. With all the talent that is spread across the continent, it may seem like a difficult task to narrow down that list of 280 players to the one player that can be considered the Most Valuable Player, but fortunately we’re here to help.
If someone asked you right now who the best lacrosse player in the world is, we’d put money down that Lyle Thompson’s name jumped into your brain. And that shouldn’t come as a surprise, especially if you paid attention to Lyle’s 2018-19 season. In a season in which he finished with 105 points (43G, 62A), Lyle continued to showcase his talents on both sides of the floor as the most complete player in the league.
With the announcement that Lyle is once again a finalist for the National Lacrosse League’s Most Valuable Player alongside Calgary’s Dane Dobbie and Buffalo’s Matt Vinc, we’re hitting the campaign trail for the 2017 NLL MVP and pleading his case for why he deserves that second MVP trophy on his mantle. While Dobbie and Vinc both had phenomenal seasons, this article will focus solely on why Lyle proved he was the best player during the 2018-19 season (that and it’s kind of hard to compare a forward and a goalie).
First, let’s lay out what Lyle did this season:
Lyle Thompson 2018-19 Regular Season Statistics |
||||||||||||||||
|
GP |
G | A | PTS | PIM | PPG | PPA | SHG | SHA | LB | TO | CTO | S | SOG | S% | SOG% |
FO |
|
18 |
43 | 62 | 105 | 6 | 8 | 13 | 1 | 1 | 94 | 32 | 16 | 220 | 158 | .195 | 71.82% | 4-9 |
Lyle led the Swarm in goals, assists, points, goals for per game, points per game, and was tied for the most power play goals on the team. He was second in assists for per game, loose balls, caused turnovers, and shooting percentage among forwards.
Compared to his MVP season, Lyle’s shooting was particularly effective. He set a new high in shooting percentage while taking less shots, and his shots-on-goal percentage was better by 2.5%.
Among NLL forwards, the University at Albany product was third in goals and points, eighth in assists, fourth in loose balls, and led in caused turnovers.
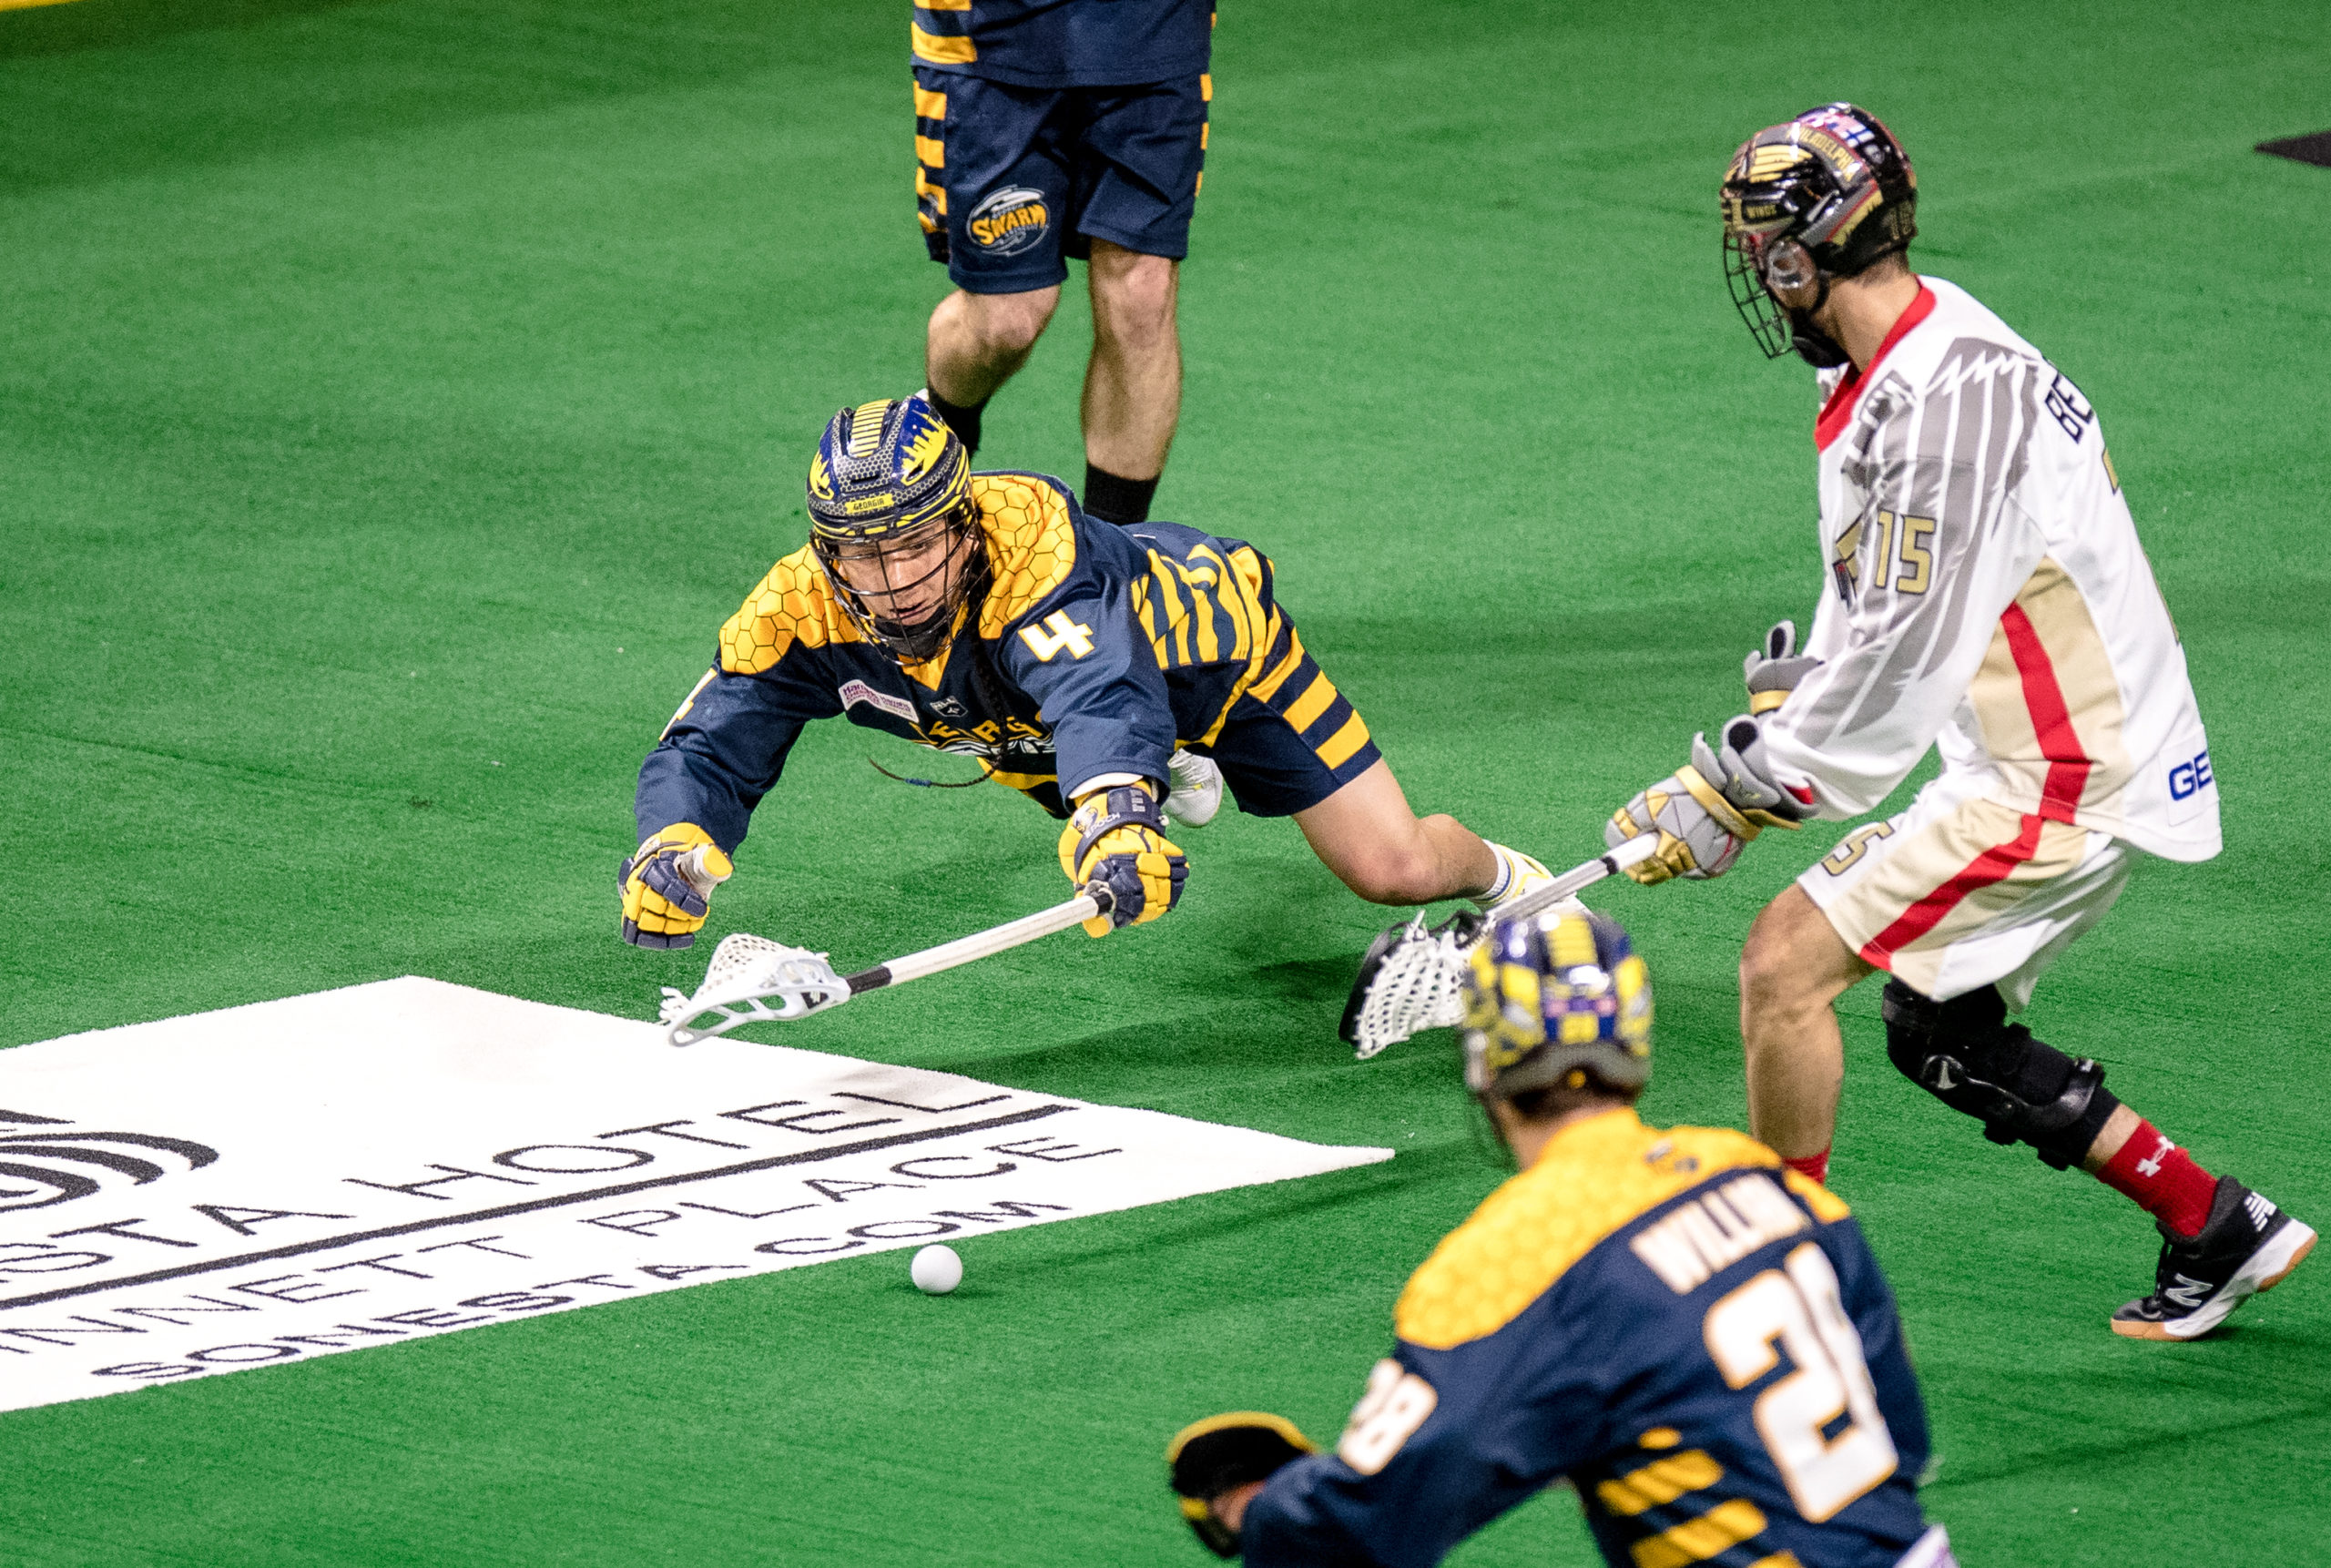
The hustle | Photo Credit: Kyle Hess
How does Lyle’s season compare to previous MVP winners? Pretty solidly:
| WINNER | YEAR | GP | G | A | PTS | PIM | PPG | PPA | SHG | SHA | LB | TO | CT | S | SOG | S% | SOG% | FO |
| Mark Matthews | 2018 | 18 | 32 | 84 | 116 | 6 | 10 | 33 | 2 | 0 | 67 | 66 | 7 | 222 | 150 | .144 | .676 | 0-0 |
| Lyle Thompson | 2017 | 18 | 45 | 71 | 116 | 8 | 10 | 27 | 3 | 1 | 126 | 62 | 15 | 232 | 161 | .194 | .694 | 21-44 |
| Dhane Smith | 2016 | 18 | 72 | 65 | 137 | 9 | 16 | 13 | 1 | 2 | 111 | 43 | 12 | 337 | 247 | .214 | .733 | 0-0 |
| Shawn Evans | 2015 | 18 | 47 | 83 | 130 | 39 | 4 | 31 | 5 | 3 | 96 | 77 | 10 | 254 | 184 | .185 | .724 | 0-0 |
| Cody Jamieson | 2014 | 18 | 36 | 72 | 108 | 26 | 8 | 11 | 1 | 4 | 70 | 58 | 3 | 200 | 140 | .180 | .700 | 0-0 |
| Shawn Evans | 2013 | 16 | 32 | 80 | 112 | 25 | 12 | 29 | 0 | 3 | 69 | 61 | 15 | 186 | 139 | .172 | .747 | 0-0 |
| John Grant, Jr. | 2012 | 14 | 50 | 66 | 116 | 24 | 19 | 20 | 2 | 1 | 57 | 54 | 2 | 219 | 192 | .228 | .877 | 0-0 |
| Jeff Shattler | 2011 | 15 | 29 | 46 | 75 | 20 | 5 | 6 | 4 | 1 | 93 | 51 | 12 | 142 | 107 | .204 | .754 | 0-0 |
| Casey Powell | 2010 | 14 | 44 | 36 | 80 | 12 | 10 | 8 | 1 | 1 | 53 | – | – | 199 | 166 | .221 | .834 | 0-0 |
| Dan Dawson | 2009 | 16 | 30 | 74 | 104 | 8 | 2 | 24 | 3 | 1 | 54 | – | – | 207 | 158 | .145 | .763 | 0-0 |
| Athan Iannucci | 2008 | 16 | 71 | 29 | 100 | 35 | 17 | 10 | 5 | 0 | 138 | – | – | 352 | 253 | .202 | .719 | 0-0 |
| John Grant, Jr. | 2007 | 15 | 51 | 60 | 111 | 40 | 14 | 22 | 5 | 6 | 81 | – | – | 272 | 199 | .188 | .732 | 0-0 |
| Colin Doyle | 2005 | 16 | 42 | 69 | 111 | 21 | 14 | 31 | 0 | 3 | 94 | – | – | – | – | – | – | – |
(A couple quick notes: we only have statistics going back to 2005, faceoffs weren’t tracked until 2006, and turnovers and caused turnovers weren’t tracked until 2011. Hence those empty cells you see. All the math below accounts for these discrepancies. Also, every MVP since ’05 has been a forward, except for when Steve Dietrich won it as a goaltender with Buffalo in 2006. He’s obviously missing from the above graph.)
Average all that out, and you get:
| G | A | PTS | PIM | PPG | PPA | SHG | SHA | LB | TO | CT | S | SOG | S% | SOG% |
| 44.7 | 64.2 | 108.9 | 21 | 10.9 | 20.4 | 2.5 | 2 | 85.3 | 59 | 9.5 | 235.2 | 174.7 | .190 | .746 |
Lyle’s just under the averages for goals, assists and points. He’s surpassed the loose balls total by a health margin, has a healthier gap between the average turnover rate and his 32 this season, and is nearly double in the caused turnover category. As noted earlier, his shooting percentage is higher than when he won MVP in 2017 and is .5% above the average.
Also of note is how Lyle’s six penalty minutes matches the low mark set by Mark Matthews last season when he won MVP. And finally, Lyle’s the only player on here to participate in faceoffs, helping showcase all he can do on the floor.
While we unfortunately do not have a wealth of defensive statistics to pull from, we all remember a time where Lyle played an offensive shift, transitioned to defense, then went right back to offense like it was nothing. Not many players have the motor that Lyle has to play as much as he does, and fewer still can be a dynamic offensive threat and play some shutdown defense.
And that shutdown defense is the real reason why we know Lyle’s the best player in the world. Like a shark sensing blood in the water, Lyle knows when to strike and get the ball back for his team, and the efforts he goes through to help the Swarm regain or extend a possession are unmatched.
Forwards sometimes get caught playing a defensive shift, and coaches tend to hold their breath hoping they aren’t taken advantage of and scored on. With Lyle, there’s no such fear. He plays cerebral defense and will go after a loose ball like his life depends on it.
Season after season, we’ve seen Lyle elevate his game and remain the game’s most complete player no matter what side of the floor he’s on. His 2018-19 campaign was no different as Lyle terrorized both zones.
And when you have a player make an impact both offensively and defensively, something few in the NLL can claim, well, that seems to us to be the definition of a Most Valuable Player, no?
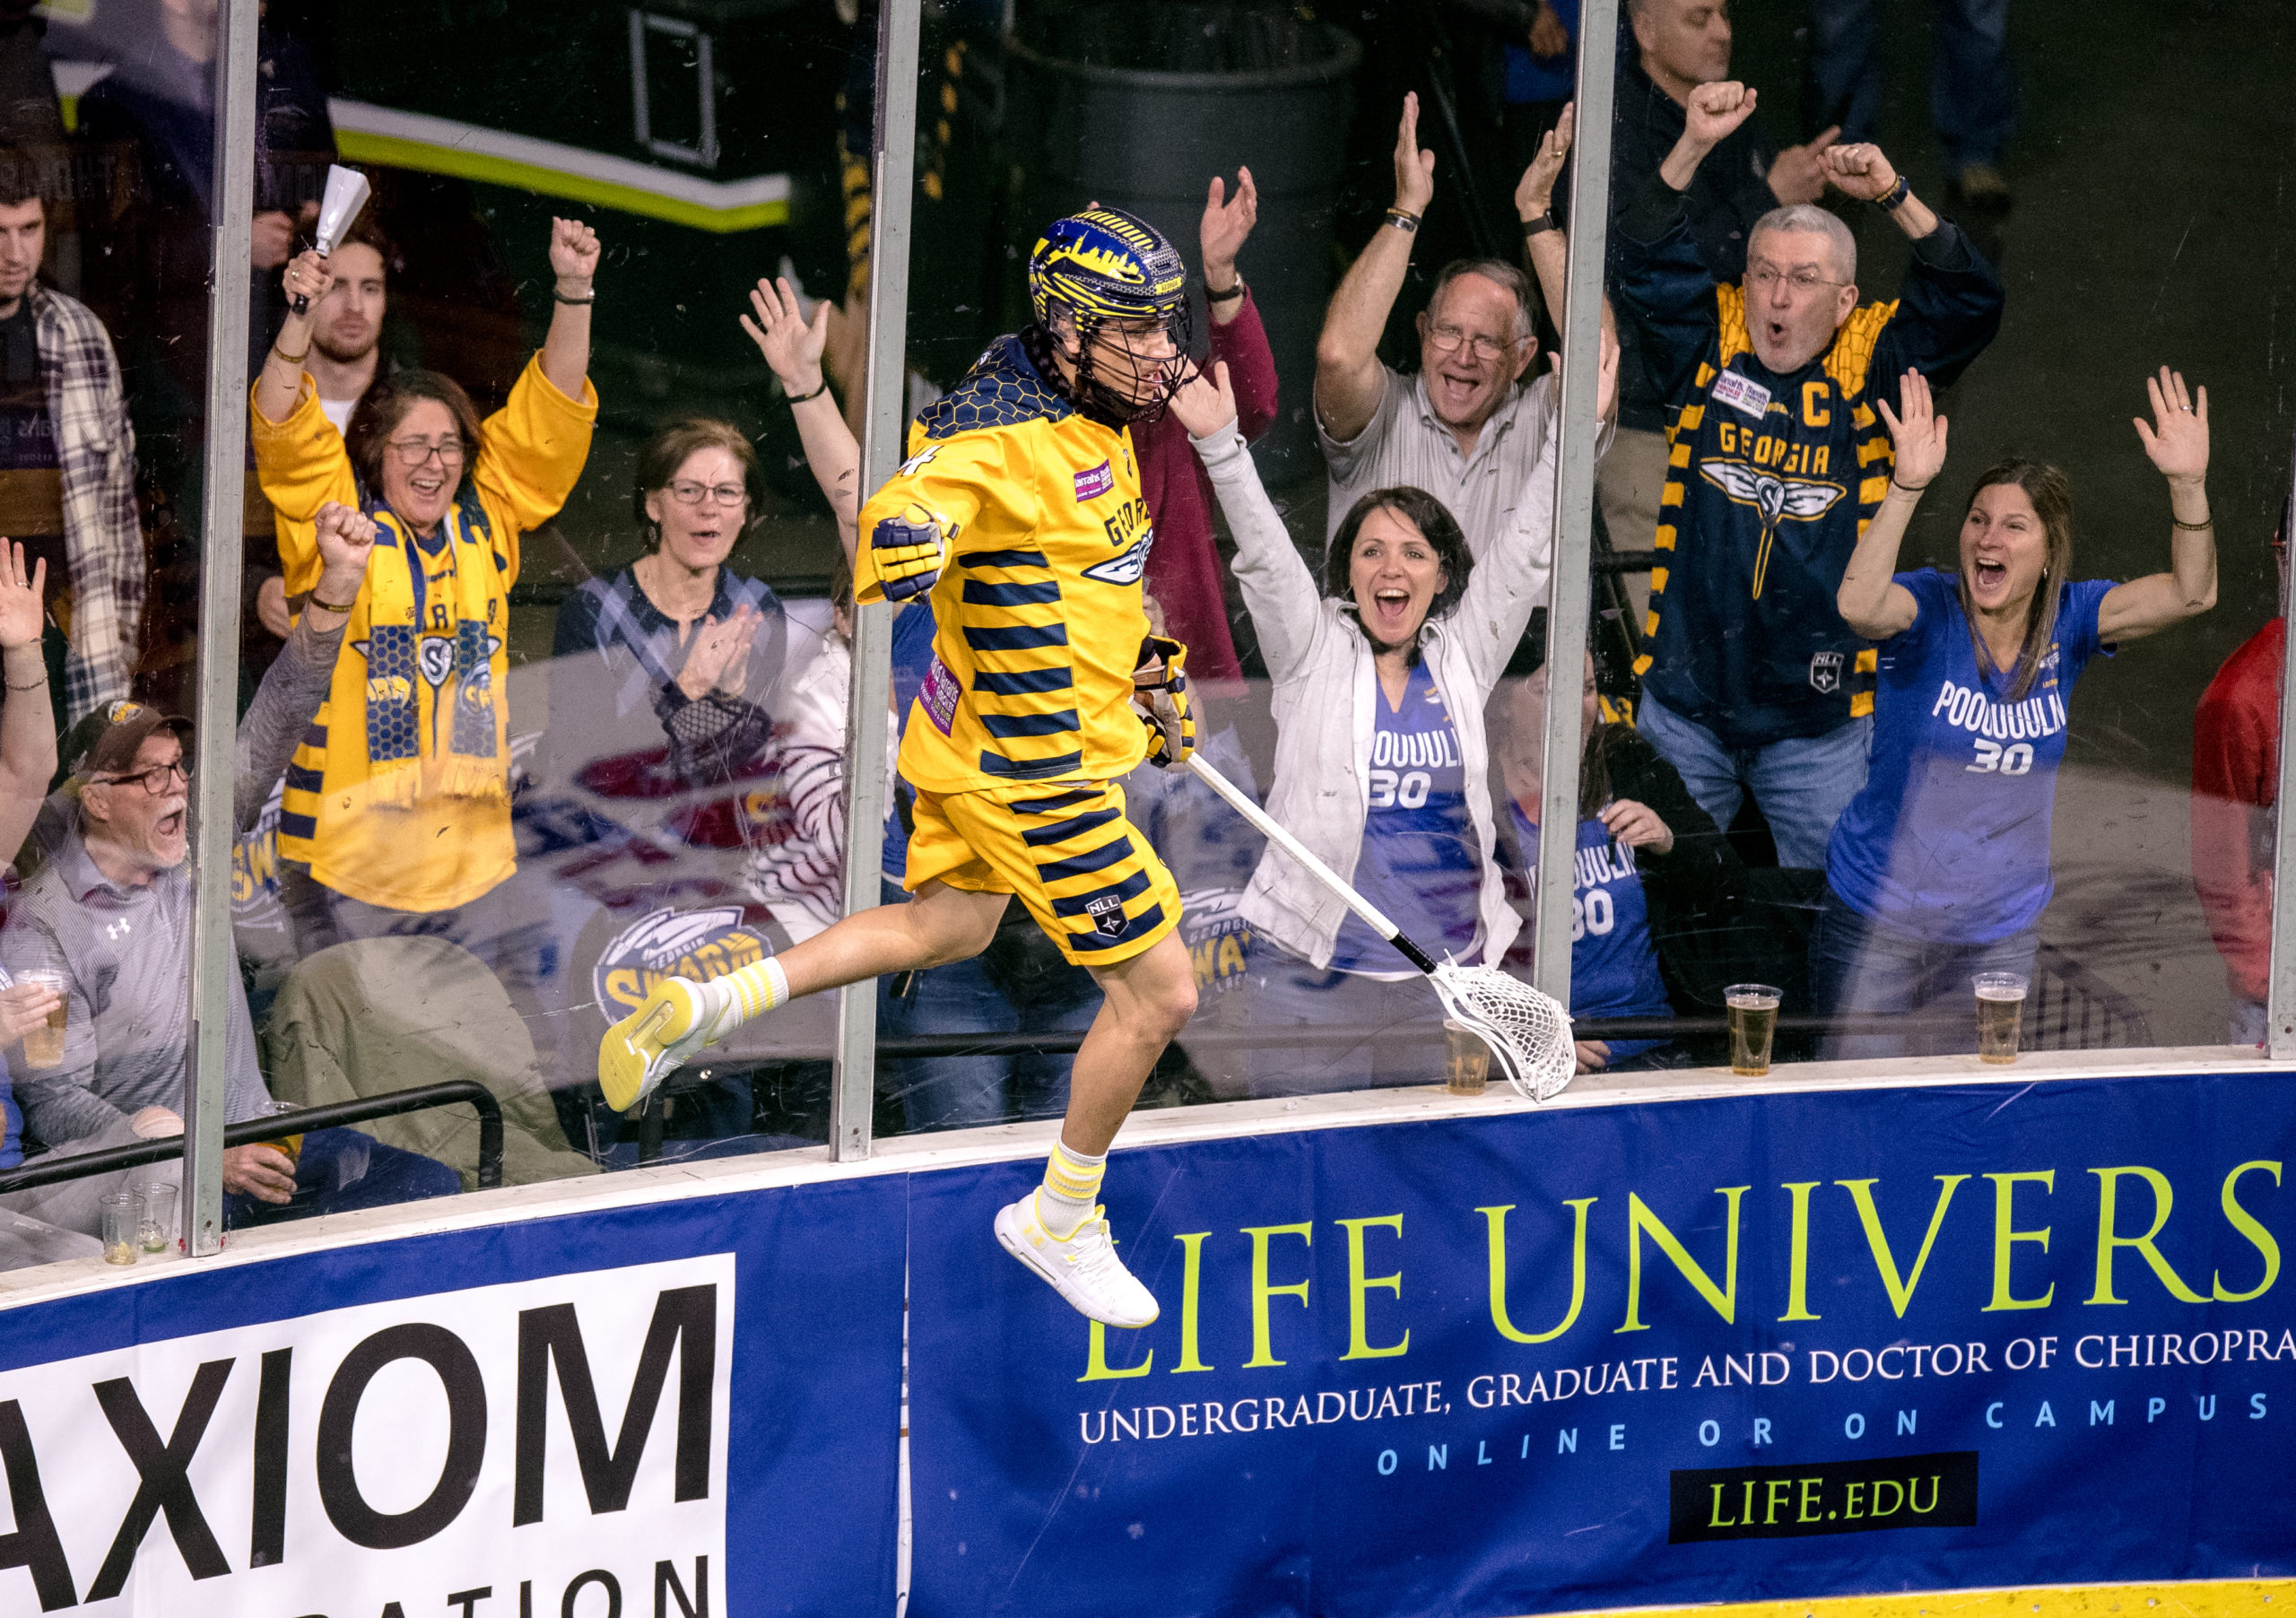
The people agree | Photo Credit: Kyle Hess